Quick answer: A financial operating rhythm is a repeatable cycle—plan, model, measure, invest—that gives MSP owners clear visibility into the true economics of their business. It replaces guesswork about hiring, pricing and growth with a system built on real numbers, reviewed on a regular cadence.
Traditional accounting shows MSP owners what already happened. A financial operating rhythm shows them what to do next. When owners understand the true economics of labor, services and cash flow, hiring decisions, pricing changes and growth targets stop feeling like guesses and start feeling deliberate.
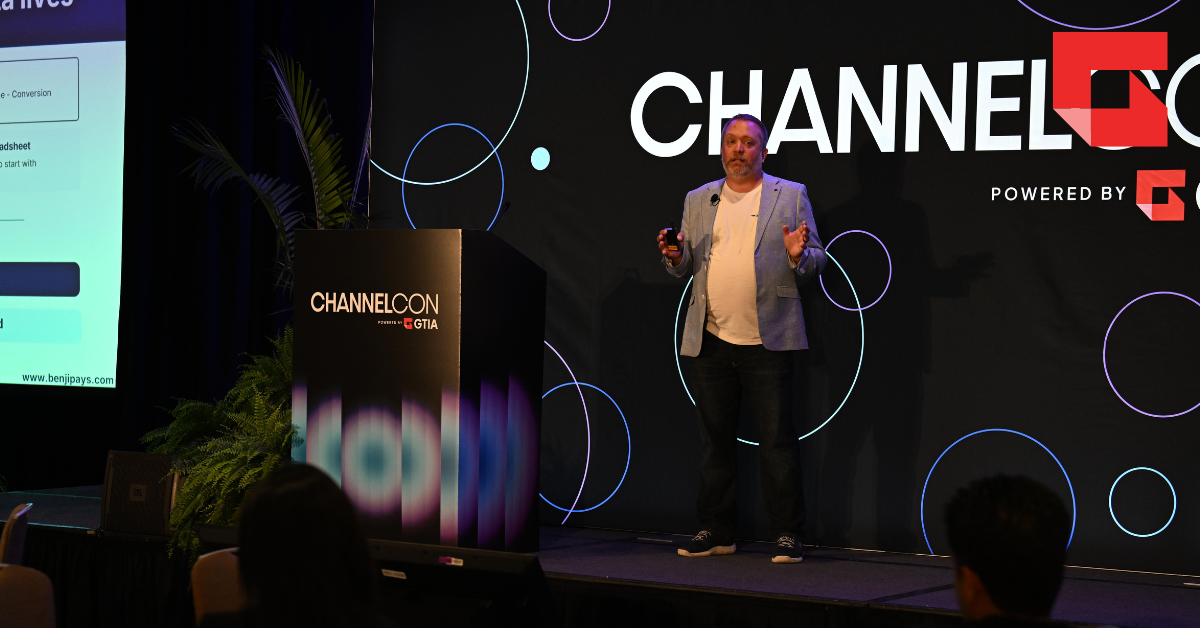
These insights come from Adam Crandall, CEO and founder of Benji Pays, who shared a practical framework for building that clarity, loosely based on the Entrepreneur Operating System (EOS).
Step 1: Set a Long-Range Vision, Then Work Backward
Start with the biggest possible timeframe. What does the business look like in 20 years—a certain revenue number, a certain headcount, a certain market position? That long view establishes the foundation the business needs today.
From there, work backward:
- 20 years out: The long-term vision
- 5 years out: The milestone that puts the business on track for that vision
- 3 years out: A nearer checkpoint
- 1 year out: The annual plan
- Quarterly and monthly targets: The breakdown of that annual plan
- Weekly actions: The "rocks"—the fixed priorities each functional leader owns
Reviewing progress on those rocks regularly keeps a leadership team focused on removing obstacles and identifies which issues are truly urgent versus which can wait.
Step 2: Translate the Vision Into a Financial Model
A financial model turns the plan into numbers: Revenue targets, profit goals, average agreement size and more. It can start as a simple spreadsheet. Work backward from the revenue goal, dividing by the business's own historical averages until the plan reaches a weekly activity number. Businesses without historical data to draw on should start tracking it immediately.
The model itself is a set of assumptions, not a perfect predictor. Its value comes from comparing those assumptions to what actually happens and closing the gap between the two.
The Numbers Every MSP Should Track
Core financial metrics:
- Revenue growth
- Gross margin
- Net profit margin
- Gross and net revenue retention
- Days sales outstanding
- Cash reserves or runway
MSP-specific KPIs:
- Agreement gross margin
- Effective hourly rate
- Utilization and labor mix
- Recurring revenue per employee
- Autopay adoption
- A/R aging
- Customer profitability
A simple dashboard built around these numbers gives a business a clear, ongoing view of its financial health.
Outcome Metrics vs. Driver Metrics
Outcome metrics describe what already happened: Revenue, gross margin, net profit, cash, recurring revenue, customer count and days sales outstanding. Driver metrics point to what to change next: Leads, meetings, close rate, average deal size, sales cycle length, churn, retention, gross margin by customer, utilization and revenue per employee. Tracking both matters. Driver metrics are the levers a business can adjust and watching them over time helps forecast the outcomes that follow.
This is also where it pays to look closely at the mix of business being sold. Recurring, profitable work that fits the service model is worth prioritizing over one-off deals that don't. Getting to the point where a business can be selective about which customers it signs is a strong sign of financial health, and customer retention compounds the growth that sales creates.
Step 3: Invest Where the Model Breaks
Every growing business runs into constraints. The next dollar of investment should go toward the place where the model is breaking—that's the clearest signal of where attention is needed.
Hiring makes the most sense wherever judgment or accountability is required. Anything repeatable—work that could run on a computer at 2:00 am—is a candidate for automation, freeing human investment for the decisions that need a human.
The Cycle Continues
Together, these three steps form a rhythm: Plan, build a model, measure against it, diagnose what's working, decide where to invest and act. Reviewing the plan on an annual basis keeps the cycle current as the business grows.
Frequently Asked Questions
What is a financial operating rhythm? It's a recurring cycle MSP owners use to plan long-term, translate that plan into a financial model, measure real results against it and decide where to invest next.
What financial metrics should an MSP track? Core metrics include revenue growth, gross margin, net profit margin, revenue retention, days sales outstanding and cash reserves, alongside MSP-specific KPIs like agreement gross margin, utilization and recurring revenue per employee.
What's the difference between outcome metrics and driver metrics? Outcome metrics show results that already happened, like revenue and profit. Driver metrics show the activities that produce those results, like lead volume and close rate, and are the levers a business can actually adjust.
How should an MSP decide where to invest next? Invest where the financial model is breaking down—that's the clearest indicator of the business's current constraint. Reserve hiring for work that requires judgment or accountability and automate anything repeatable.
Get more business building tips and resources on the GTIA Member Portal.
Not a member yet? Join now.